Data visualizations
Charts, maps, timelines and comparisons. Make studies, markets and trends easier to understand, with clearly identified sources and units.
Data visualizations, simulators and interactive modules that make complex subjects clear, services tangible and content worth exploring.
A cash runway simulator: change the cash balance, monthly revenue and monthly costs to see the effect on your operating horizon. A business question that travels across markets.
Illustrative USD scenario, with constant monthly flows. Excludes financing, taxes, payment timing and exceptional costs. Not a financial forecast.
Turn a complex topic into a personal, practical experience: explore gross and net pay, compare job offers and simulate a pay rise. A French-language service built for the French salary context.
Explore Salaire Pratique (FR) ↗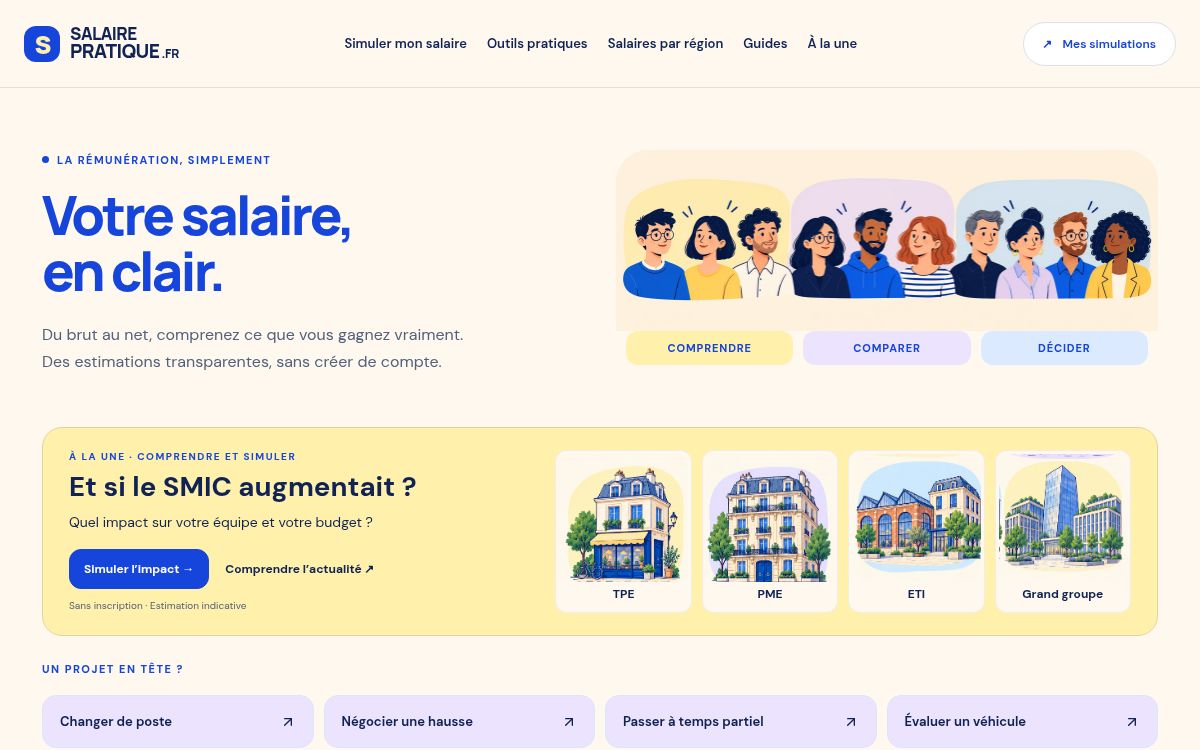
Change a view, test an assumption, explore a service. Four formats to discover what interaction can bring to your subject.
A measure rises from 20% to 30%. How many percentage points has it gained?
Choose an answer to reveal the explanation.
A visualization helps readers compare and understand. This example uses fictional data.
Create a format like this ↗Charts, maps, timelines and comparisons. Make studies, markets and trends easier to understand, with clearly identified sources and units.
Guided journeys, explorable diagrams and service demonstrations. Explain an offering or a process, one step at a time.
Calculators, scenarios and diagnostics. Let people explore their own situation with explicit assumptions and understandable results.
Quizzes, interactive features and event experiences. Build a story your audience can participate in, on your website or in a dedicated space.
An interaction embedded in an article, study or product page. Concept, design, development and integration preparation.
Discuss your module ↗An editorial feature or microsite combining several formats, a guided narrative and a coherent visual identity.
Imagine your experience ↗A collection of formats for publications and campaigns. Templates, production schedules and update arrangements defined together.
Build your programme ↗Quoted according to data, interactions, integration and maintenance needs. Hosting and updates are scoped at the outset.
As DECODE MEDIA’s in-house studio, PIXELMOOD brings editorial thinking, design and development together. We work on the question to explain as much as the way to represent it.
Distribution through the group’s publications can be discussed separately, depending on the format and editorial or commercial framework.
An event experience and an interactive quiz exploring generations of technology. A combination of storytelling, visual identity and audience participation.
Explore the project ↗An educational presentation of AQQI’s announced features. Prepared for an editorial story, this French-language demonstration is not a client case study or a commercial partnership.
A study to showcase, an offering to explain, an event to bring to life. Tell us about your audience, your content and what you want people to do.
Use the studio’s existing project enquiry form. The selected format and referral link information accompany your enquiry, without tracking cookies.
We use your details to respond to your enquiry. Please do not share confidential data in this first exchange.